SA-West Hindcast v1.0
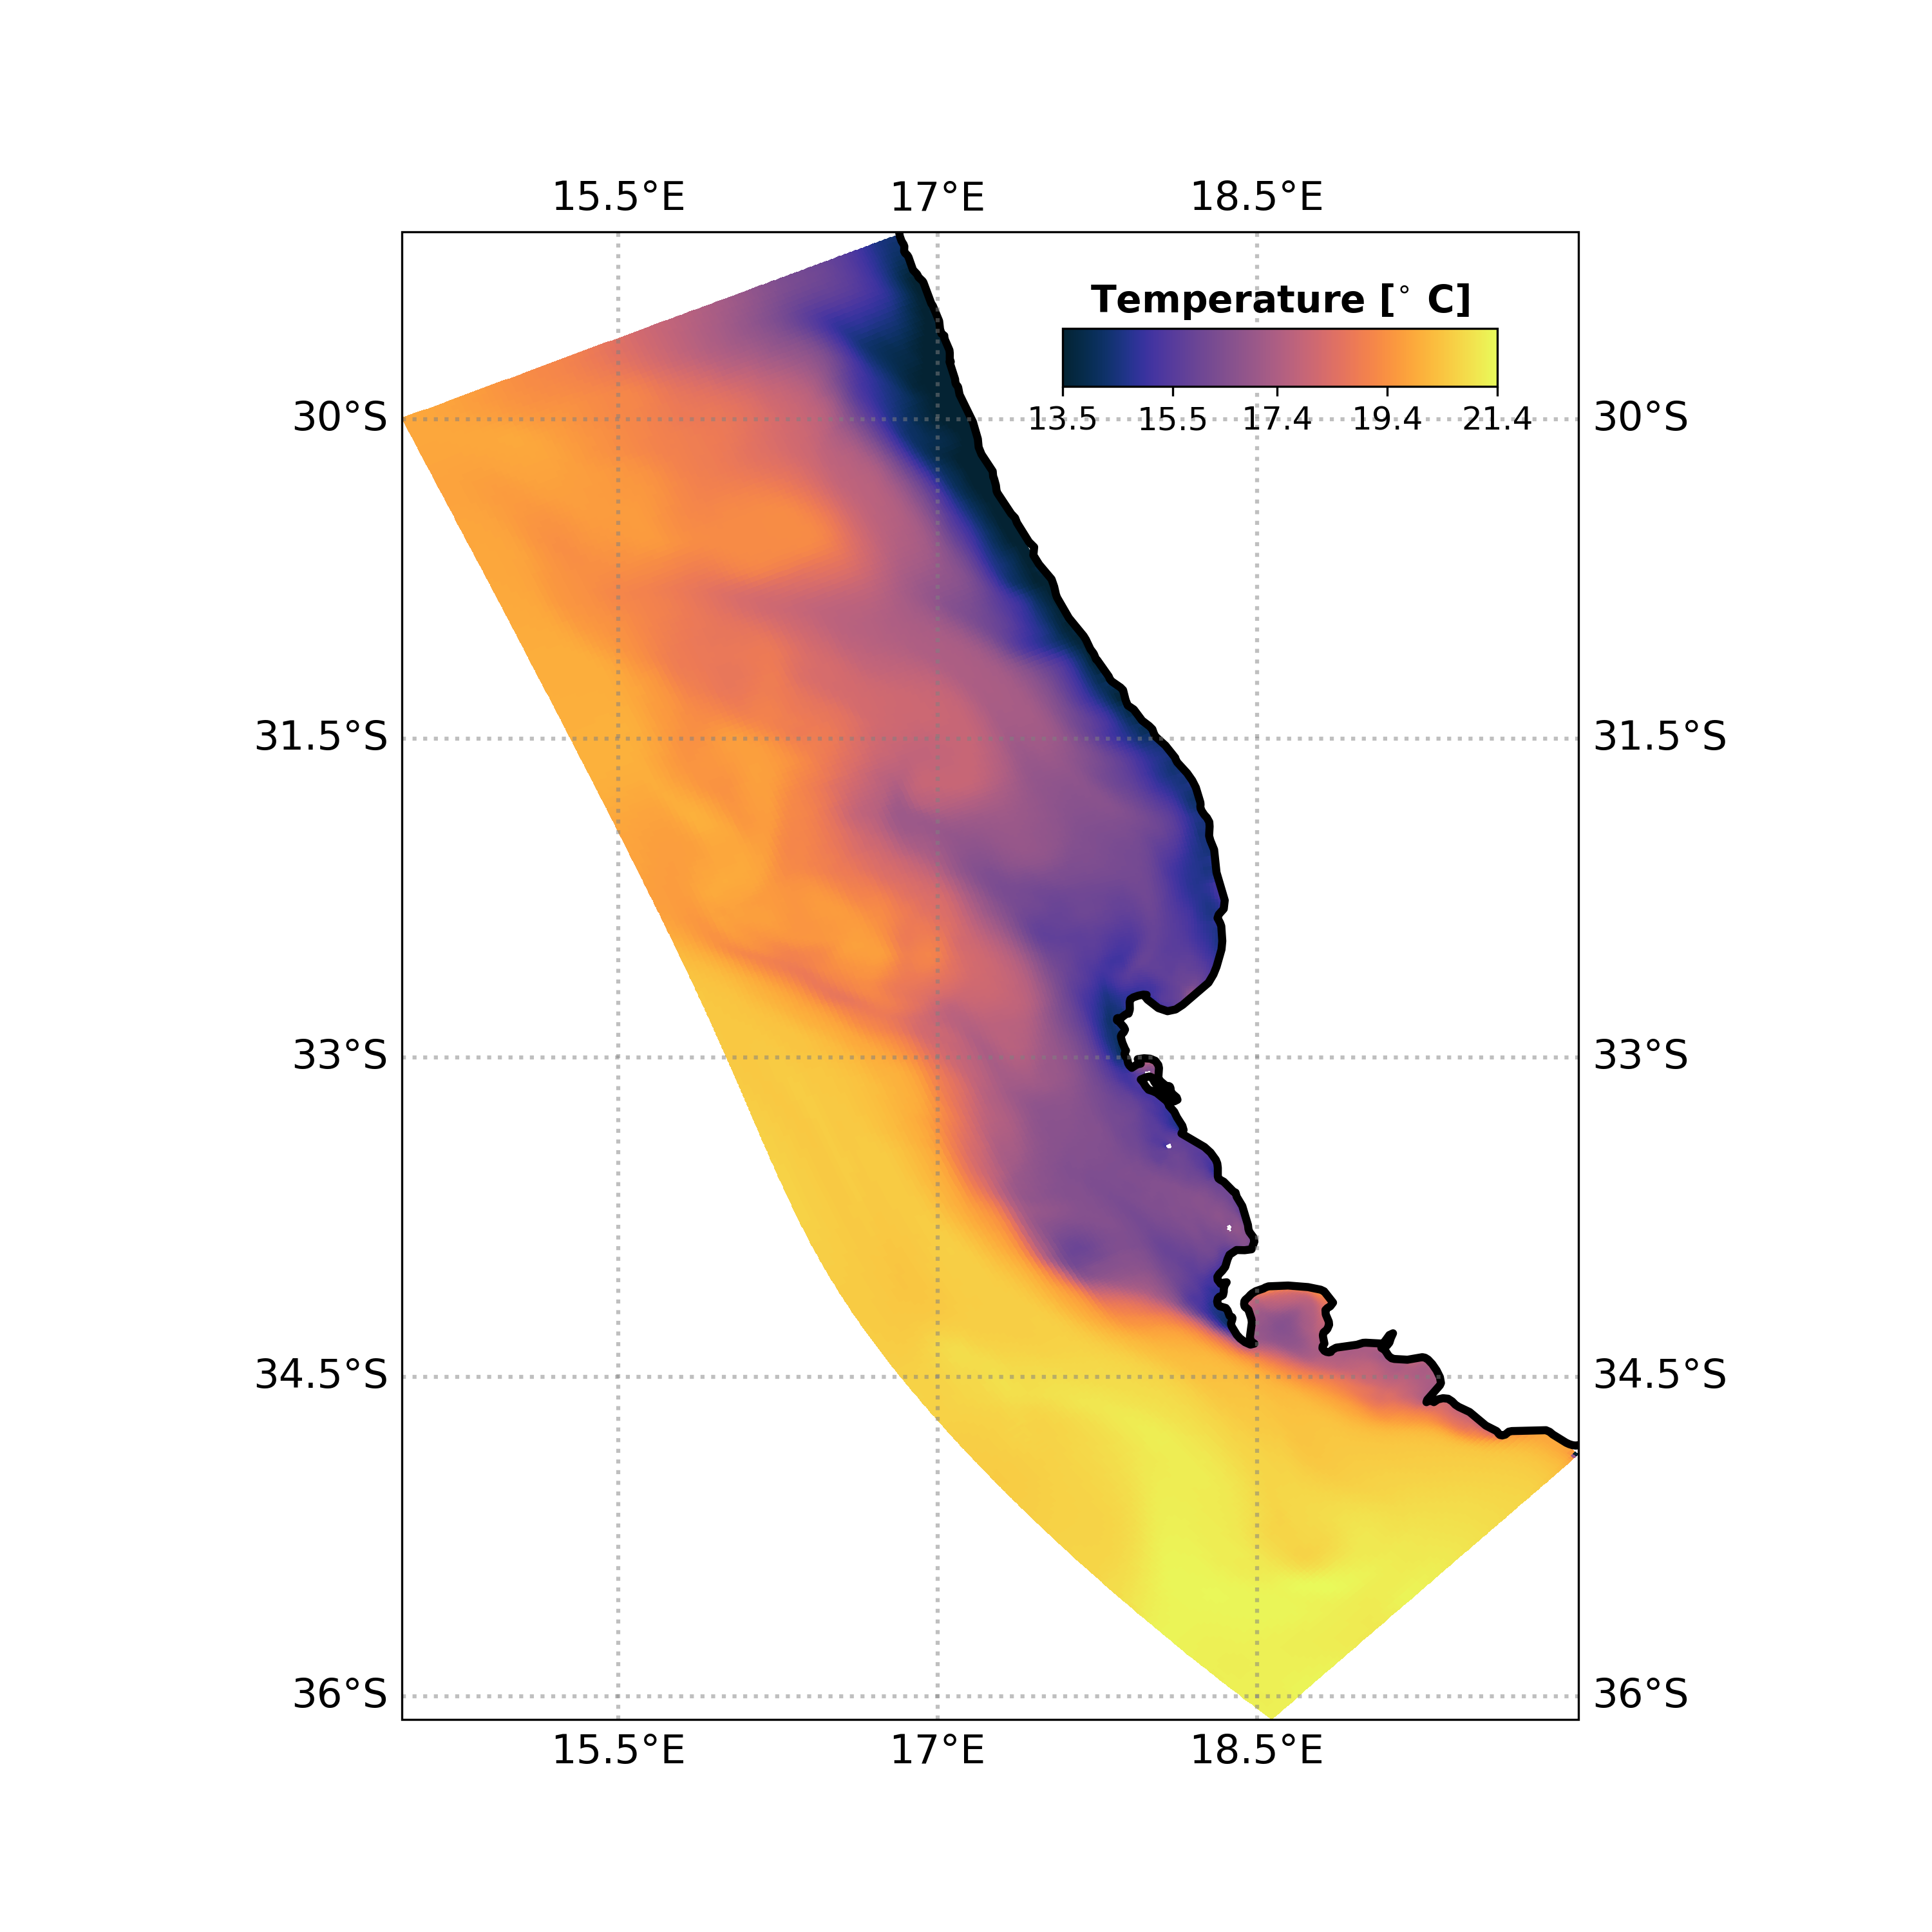
The SA-West Hindcast product provides a 32 year historical representation of the ocean state for the west coast of South Africa. The model was developed using the Coastal and Regional Ocean COmmunity (CROCO) modelling system.
The model curvilinear grid has a variable horizontal grid resolution (1 – 2.5 km) which increases toward the coast. The model has 30 terrain-following (sigma) vertical levels. Open boundary conditions for the model are obtained from GLORYS12V1. Surface forcing is interpolated from ERA5. Model bathymetry is interpolated from digital navigation charts provided by SANHO. This configuration does not include tides.
The model configuration files can be found at the somisana-croco github repository using compile options in the `C01` directory in the provided link.
NetCDF model output files are available as daily averages throughout the water column, and hourly averages for the surface layer of the model. Subsets of the files can be downloaded via Thredds protocol or alternatively entire files can be downloaded via our Mnemosyne file server. The provided model output files have been modified from the raw output format to conform to CF-compliant standards. The raw model output files are however archived separately and can be made available upon request.
VALUE ADDED PRODUCTS
Marine Heat Waves (MHW)/ Marine Cold Spells (MCS)
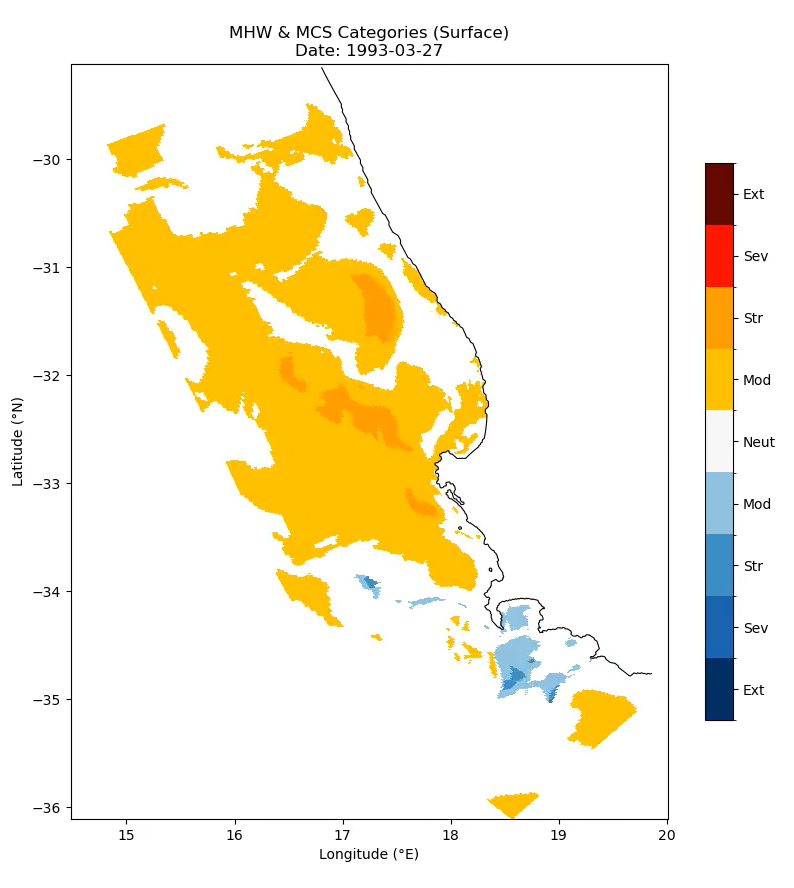
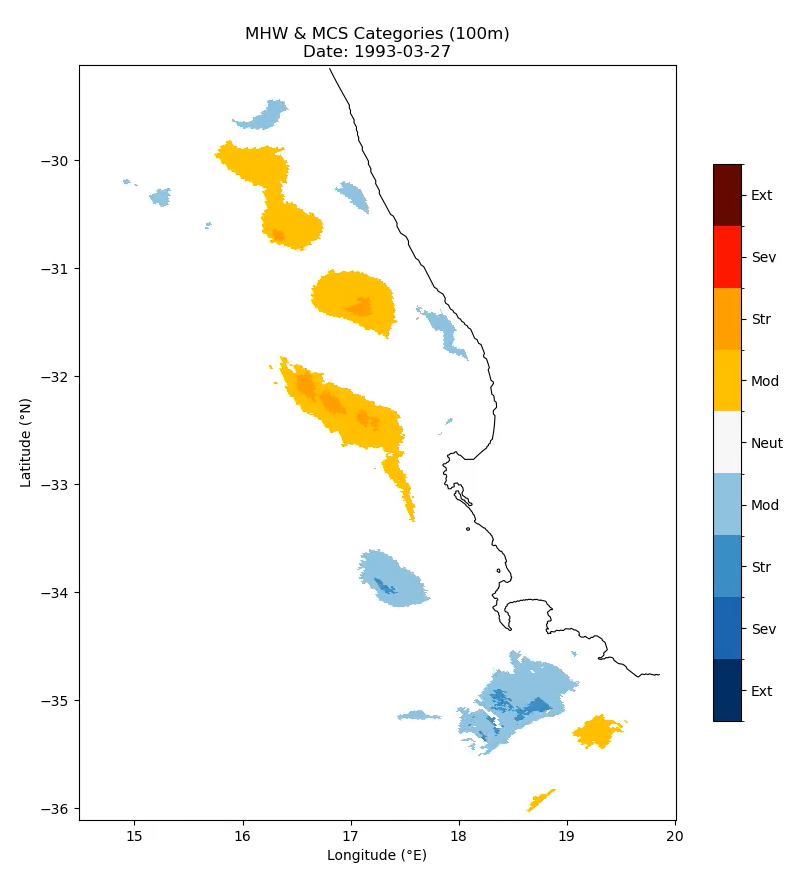
Marine heat waves are described by Hobday et al (2016) as periods of anomalous temperatures above the 90th percentile that persist for 5 or more days with breaks of no more than 2 days. Schlegel (2021) further described marine cold spells as periods of anomalous temperatures below the 10th percentile of temperature, that persists for 5 or more days with breaks of no more than 2 days.
In our workflow the day-of-year climatology was computed along with the 90th and the 10th percentile of temperature from the 32 year temperature dataset above. To detect the MHWs and MCSs we iterate through each day of the timeline and capture where the threshold is exceeded for a prolonged time. thereafter we apply the categorisation in Hobday et al (2018) to classify the intensity of the event.
The day-of-year climatology along with the 90th and 10th percentile thresholds are available in a combined NetCDF file. the category flags are also available as a separate NetCDF file.
Hobday, A. J., et al. (2016). A hierarchical approach to defining marine heatwaves. Progress in oceanography, 141, 227-238.
Hobday, A. J., et al. (2018). Categorizing and naming marine heatwaves. Oceanography, 31(2), 162-173.
Schlegel, R. W., et al. (2021). Marine cold-spells. Progress in Oceanography, 198, 102684.
Info
-
Resources
📄 github config files
-
Details
Horizontal Resolution: 1 – 2.5 km
Vertical Extent: Full water column
Vertical Resolution: variable - 30 sigma levels
Temporal Extent: January 1993 to November 2025
Temporal Resolution: daily for full water column, hourly for surface
Variables: averaged free-surface elevation (zeta), averaged vertically integrated u-momentum component (ubar), averaged vertically integrated v-momentum component (vbar), averaged u-momentum component (u), averaged v-momentum component (v), averaged potential temperature (temp) and averaged salinity (salt) -
DOI
10.15493/SOMISANA.26032025